Over the past few weeks we’ve been blown away with some of the hilarious graphs the folks over at Graphjam have been coming up with. For instance check out the “relative amount I’m tempted by various fruits,” “amount I’ll be watching you at various points in the day,” and “Kenny’s Knowledge.”
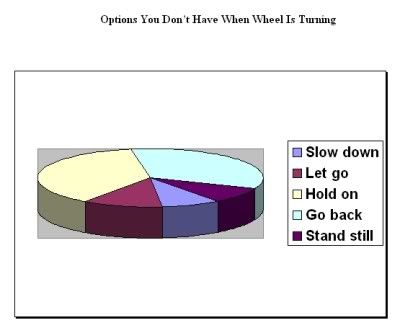
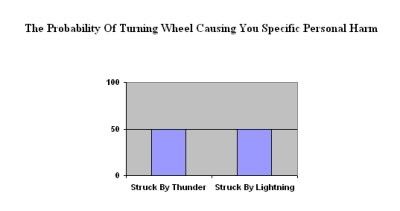
We didn’t want to let those guys have all the fun, so we took a shot:
- Grateful Dead: The Wheel (animated video)
- Previously on HT: Geeking Out: We’ve Got Seven Line Graphs
8 Responses
Does anyone else find this song insufferably boring?
when i was sitting in my junior high math class never, NEVER, did i expect to crave graphs for pure entertainment. pleasssseee, more graphs and/or musical mathematics.
i guess what it comes down to is that i like to keep it basic. im a big supporter of colors, shapes, numbers, and textures…among other things.
I’m no scientist, but I suspect the probability of getting struck by thunder is slightly lower than that of lightning.
Good stuff.
I’m just going off the research performed by the esteemed Dr. Jerome Garcia. According to his extensive studies, apparently both thunder AND lightning can “get you.” He did not, sadly, indicate probabilities of each calamity, so we are left to surmise that relative odds are 50/50.
Top notch research Chilly.
Hunter probably had more to do with that thesis than Garcia, considering he wrote the words.
I still think The Wheel is one of the more boring tunes in the repertoire.
Ultimately my research shows that you’re bound to cover a little more ground, regardless.
great link! love it!